Chromospheric evaporation flows and density changes deduced from Hinode/EIS during an M1.6 flare.
Authors:
P. Gomory, A. M. Veronig, Y. Su, M. Temmer, J. K. Thalmann
Image & caption:
Please click on image thumbnail to get more info:
Image caption::
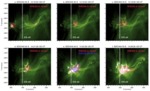
SDO/AIA 94 Å filtergrams (background images) at six different times showing the evolution of flare loops at a temperature around 6 MK. RHESSI X-ray sources are shown as contours in red (4–10 keV) and blue (20–50 keV). They show the locations of X-ray-emitting thermal plasma and nonthermal electrons. The contour levels are 5, 30, and 80% of the peak intensity. The white rectangle depicts the lower part of the Hinode/EIS slit.
Description:
We analyzed high-cadence sit-and-stare observations acquired with the Hinode/EIS spectrometer and HXR measurements acquired with RHESSI during an M-class flare. During the flare impulsive phase, we observe no significant flows in the cooler Fe XIII 202.044 Å (log T = 6.2) line but strong upflows, up to 80-150 km/s, in the hotter Fe XVI 262.980 Å (log T = 6.4) line. The largest Doppler shifts observed in the Fe XVI line were co-temporal with the sharp intensity peak. The electron density obtained from a Fe XIII line pair ratio exhibited fast increase (within two minutes) from the pre-flare level of 5.01x10^(9) cm^(-3) to 3.16x10^(10) cm^(-3) during the flare peak. The nonthermal energy flux density deposited from the coronal acceleration site to the lower atmospheric layers during the flare peak was found to be 1.34x10^(10) erg/s/cm^(-2) for a low-energy cut-off that was estimated to be 16 keV. During the decline flare phase, we found a secondary intensity and density peak of lower amplitude that was preceded by upflows of 15 km/s that were detected in both lines. The flare was also accompanied by a filament eruption that was partly captured by the EIS observations. We derived Doppler velocities of 250-300 km/s for the upflowing filament material. The spectroscopic results for the flare peak are consistent with the scenario of explosive chromospheric evaporation, although a comparatively low value of the nonthermal energy flux density was determined for this phase of the flare. This outcome is discussed in the context of recent hydrodynamic simulations. It provides observational evidence that the response of the atmospheric plasma strongly depends on the properties of the electron beams responsible for the heating, in particular the steepness of the energy distribution. The secondary peak of line intensity and electron density detected during the decline phase is interpreted as a signature of flare loops being filled by expanding hot material that is due to chromospheric evaporation.
 SAS
SAS