Analyses of magnetic field structures for active region 10720 using a data-driven 3D MHD model
Authors:
S.T. Wu, A.H. Wanga, A. Kucera, J. Rybak, Y. Liu, B. Vrsnak, V. Yurchyshyn
Image & caption:
Please click on image thumbnail to get more info:
Image caption::
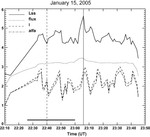
The simulated non-potential parameters (i.e.length of magnetic shear
of the main neutral line; magnetic flux; net electric current;
and normalized measure of the field twist) at various times for AR
10720, on January 15, 2005. The horizontal bold line indicates the
impulsive phase of a flare, the vertical solid line shows the
occurrence of a CME in the LASCO/C2 field of view, and the vertical dashed line indicates the back extrapolated time of the CME launch.
Description:
In order to understand solar eruptive events (flares and CMEs) we
need to investigate the changes at the solar surface. Thus, we use
a data-driven, three-dimensional magnetohydrodynamic (MHD) model to
analyze a flare and coronal mass ejection productive active region,
AR 10720 on January 15, 2005. The measured magnetic field from Big
Bear Solar Observatory (BBSO) digital vector magnetograph (DGVM) was
used to model the non-potential coronal magnetic field changes and
the evolution of electric current before and after the event occurred.
The numerical results include the change of magnetic flux, the
net electric current, the length of magnetic shear of the main
neutral line, the flux normalized measure of the field twist. The
current helicity injected into the corona and the photospheric
surface velocity are also computed. The characteristic parameters
of the buildup process before the event and the decay process after
the event are investigated and the amount of magnetic energy
converted to drive the event is estimated.
 SAS
SAS