Periodicities in Irradiance and in other Solar Activity Indices During Cycle 23
Authors:
T. Atac,, A. Ozguc, J. Rybak
Image & caption:
Please click on image thumbnail to get more info:
Image caption::
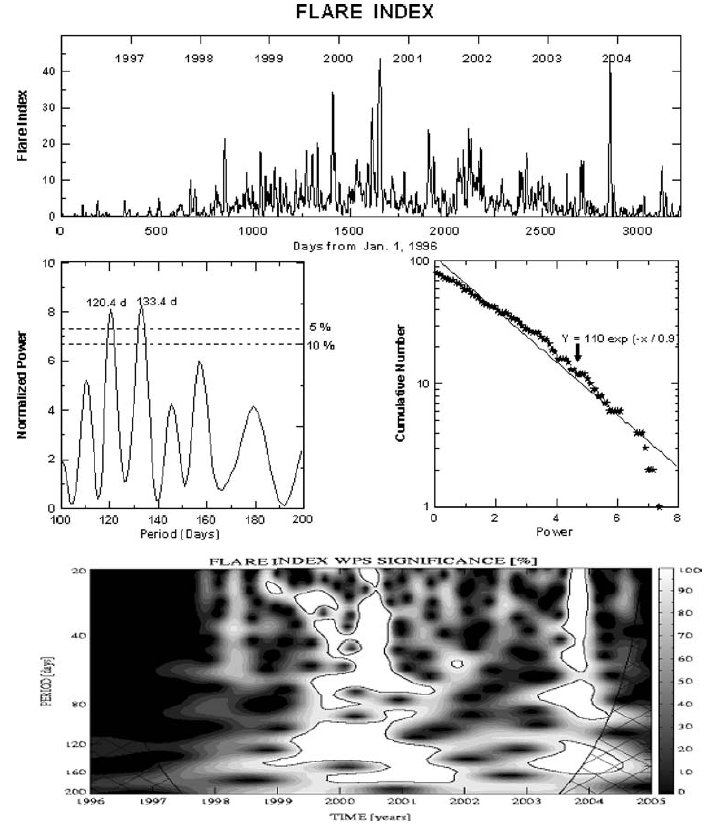
Behaviour of the daily values of the solar flare index (top panel). Normalized power
spectra of the solar flare index (middle left panel) and power distribution of discrete Fourier
transform (middle right panel). The wavelet power spectra of the flare index time series for the
period range 20 – 200 days (bottom panel). Grey-scale coding of power from black to white represents
the confidence levels of the local power above the noise level assuming noise independence on periods.
The cone of incidence is marked by the cross-hatched regions.
Description:
Magnetic fields give rise to distinctive features in different solar atmospheric regimes. To study this, time variations of the flare index, sunspot number and sunspot area, each index arising from different physical conditions, were compared with the solar composite irradiance throughout cycle 23. Rieger-type periodicities (~150 days) in these time series were calculated using Fourier and wavelet transforms. The peaks of the wavelet power of these periodicities appeared between the years 1999 and 2002. We found that the solar irradiance oscillations are less significant than those in the other indices during this cycle. The irradiance shows non-periodic fluctuations during this time interval. The peaks of the flare index, sunspot number and sunspot total area were seen around 2000.4, 1999.9 and 2001.0, respectively. These periodicities appeared intermittently and were not simultaneous in different solar activity indices during the three years of the maximum phase of solar cycle 23.
 SAS
SAS